Montana State Legislature
MARA Data Project
THRIVING IN A CHANGING WORLD
DATA DRIVEN DECISION MAKING
DATA DRIVEN DECISION MAKING
Legislative non-partisan staff under the direction of the Modernization and Risk Analysis (MARA) Committee compiled data from across Montana. Once the data was put together, economic, demographic, and financial interactions and trends emerged providing a glimpse at the future.
The accordions below demonstrate the long-term comprehensive look at the interconnectedness of government in Montana. Navigate these accordions for more information from studies, reports, and interactive data tools.
ABOUT
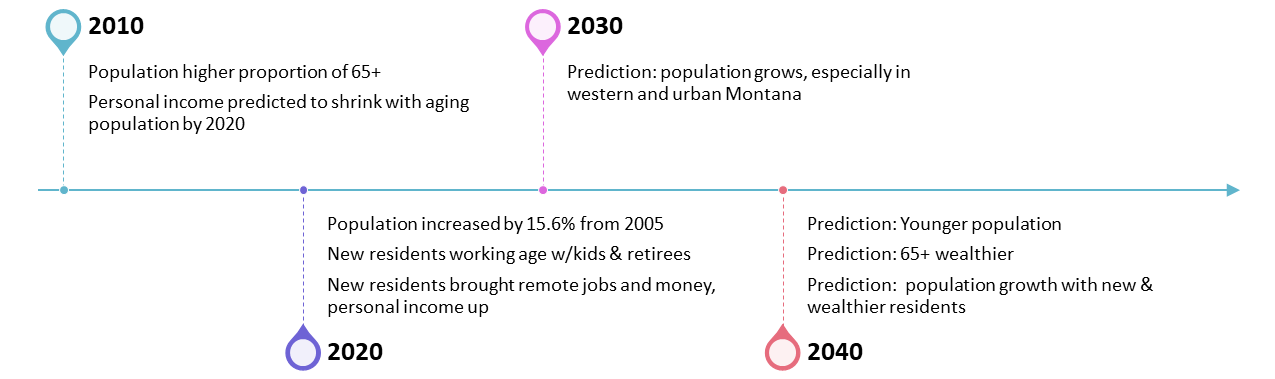
Population impacts the Montana economy and particularly personal income in Montana. The correlation between population and personal income was analyzed by non-partisan legislative staff and important findings are included below.
Key Takeaways
- By 2040, Montana's population is predicted to be 1.3 million.
- On average, new residents earned more in 2020 across all ages, but the top 10% of new residents earned far more than their resident counterparts. Read this report for more details.
- Montana has a heavy and growing reliance on income tax revenues. Individuals and corporations often control when and how much income taxes they pay making income tax (both individual and corporate) collections extremely volatile.
- If predictions are correct, and Montana's population is 1.3 million by 2040 the following areas would be impacted:
- Housing & Cost of Living
- School Enrollments
- Health Care
- Correctional Institutions & Public Safety
- Infrastructure
- More
*Click the link below this image to access the MT Population data tool*

» Montana Population History & Forecast Tool
- Population
- Reports
- Montana's Changing Population & Demographics: 2024 Update (Josh Poulette, Legislative Fiscal Division)
- Reports
- Personal Income
- Reports
- Individual Income Tax: Analysis of CY 2020 New Residents & Income Trends After Moving OCTOBER 2023 (Sam Schafer, LFD)
- Individual Income Tax: Analysis of CY 2020 New Residents & Income Trends After Moving MARCH 2022 (Sam Schafer, LFD)
- Individual Income Tax Report (Volatility Report IV, Legislative Fiscal Division, September 2022)
- Presentations
- Individual Income Tax: Analysis of CY 2020 Income Trends After Moving (Sam Schafer, Legislative Fiscal Division, October 2023)
- Individual Income Tax: Highlights of CY 2020 Income Data Analysis (Sam Schafer, Legislative Fiscal Division, November 2022)
- Reports
ABOUT
As part of the MARA project’s modular approach the committee and several national experts discussed trends in cost of living, including housing and childcare. Staff created visualizations of trends in Montana’s housing market and childcare system. Read below for more on the cost of living in Montana.
Key Takeaway
- Montana is facing a housing supply shortage as population growth has outpaced housing growth. This shortage has led to increased housing prices.
- The Governor’s Housing Task Force has issued a preliminary draft report with a series of policy interventions intended to address these issues.
- Montana also faces a shortage of child care supply. This shortage impacts labor force participation in the state. Montana does receive federal funding for child care, including pandemic relief funding.
*Click the link below this image to access the cost of living data tool*

» Montana Cost of Living Tool
*Click the link below this image to access the housing sales data tool*

» Montana Housing Sales Tool
- Cost of Living
- Reports
- Cost of Living Documentation Methodology (Molly DelCurto, LFD, August 2021)
- Videos
- Montana Cost of Living (Video)
- Reports
- Housing
- Reports
- 2021 Housing Legislation Summary (Toni Henneman, Legislative Services Division)
- Benefits Cliff of Public Assistance Programs (Erin Sullivan Economic Affairs Interim Committee)
- Governor's Housing Task Force Draft Report
- Previous Session Legislation on Housing (Toni Henneman, Legislative Services Division)
- Presentations
- Montana Housing Update (Montana Housing, Cheryl Cohen)
- Montana Housing Shortage (PEW Charitable Trusts)
- Where Housing is Headed (Patrick Barkey, Bureau of Business & Economic Research)
- Reports
- Childcare
- Reports
- Impacts of Childcare on the Montana Workforce (Department of Labor & Industry)
- Presentations
- Childcare Gap Assessment: Montana (Bipartisan Policy Center)
- How Work & Childcare are Changing (Linda K. Smith, Bipartisan Policy Center)
- Reports
ABOUT
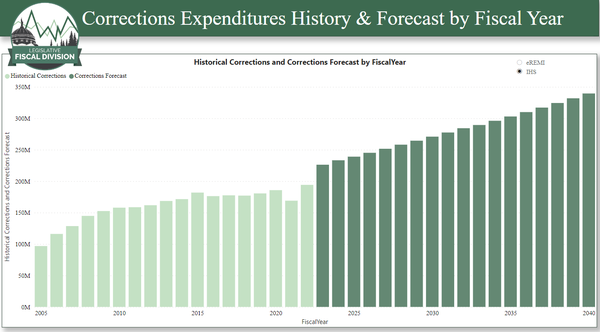
In 2005 Montana population was about 940,000. By 2040, population is predicted to increase to about 1.3 million. Government services for the treatment and housing costs are impacted if correctional inmate populations increase, however determining the age of Montana's future population is important as criminal activities tend to decline with age.
Non-partisan legislative staff gathered public safety data to analyze trends in inmate populations, however more work is needed to develop the data before advanced analysis of the growth in general population and inmate population growth.
The Legislative Fiscal Division thanks the executive branch's data effort for their collaborative role in the continued development of public safety data collections. When these data are available, both the legislative and executive branches will be enabled to provide improved analysis to decision makers.
Key Takeaway
- Increased expenditures in correctional institutions are driven by increases in the average annual cost per inmate over time. Compared to FY 2021, expenditures are expected to double by 2040, with much of the growth attributed to inflation.
- No integrated, diverse criminal justice data warehouse exists to track effectiveness of improvements and assess services
- Bill draft LC0357 is requested for the 2023 legislative session by the Law and Justice Interim Committee to enable the collection and compilation of criminal justice data across Montana state agencies to allow quantitative assessments
- Next steps - collect and compile criminal justice data across Montana to analyze correctional inmate populations by age cohort relative to general Montana population
*Click the link below this image to access the public safety data tool*
» Corrections Expenditures History & Forecast Tool
- Public Safety
- Reports
- HJ 29: Study of Victim Services & Funding in Montana (Catherine Duncan, LFD, July 2022)
- HJ 31: Study of Criminal Justice System Data in Montana (Rachel Weiss, Law & Justice Interim Committee)
- HJ 34: Study Pretrial & Presentence Diversion Programs (Milly Allen, Criminal Justice Oversight Council)
- Montana Drug Court Overview
- Montana Drug Courts: An Update Snapshot of Success & Hope (Montana Supreme Court, Office of Court Administrator)
-
Montana Victim Services (Montana Board of Crime Control)
- Crime Victim Advocacy Survival Guide (Gallatin County Victim Services)
- Notice of Rights & Services for Victims of Violent Crimes
- Victim Services: Gallatin County
- VOCA Funded Services Provided in Montana (Montana Board of Crime Control)
- Public Safety Module Summary
- Restorative Justice / Victim Programs (Department of Corrections)
- SJ 26: Study Women's Prison
- Presentations
- Legislative Action
- Bill Draft to Create a Montana Criminal Justice Data Warehouse.
- Reports
ABOUT
As part of the MARA project’s modular approach the committee discussed the future of health care. Staff created a projection of future trends in Montana’s Medicaid system, which is easily the largest state health program. Read below for more on Medicaid and the future of health care.
Key Takeaway
- Increased expenditures in Medicaid are driven by increases in the average annual cost per enrollee over time. As compared to FY 2022, Medicaid spending is projected to double by 2035.
- Medicaid enrollment is driven largely by macroeconomic conditions.
- States can exercise some control over the structure and operation of their Medicaid and other health systems and thus do have some control over future state health expenditures.
*Click the link below this image to access the healthcare data tool*

» Medicaid Expenditure History & Forecast Tool
- Healthcare
- Reports
- Presentations
- Leveraging Medicaid to Drive Value in State Health Care Delivery (Patti Boozang, Manatt)
- NASHP Hospital Cost Tool (Marilyn Bartlett, National Academy for State Health Policy)
- Rural Healthcare into 2040 (Carrie Cochran-McClain, National Rural Health Association)
- State Strategies for Health Cost Growth Containment (Maureen Hensley-Quinn, NASHP)
- Trends in Health Care (Michael Chernew, Harvard)
ABOUT
MARA looked at the current and future Education trends. The investigation led to further work and research by the Education Interim Committee and the Education Interim Budget Committee and other education leaders in the state. Links below capture the work of the various entities.
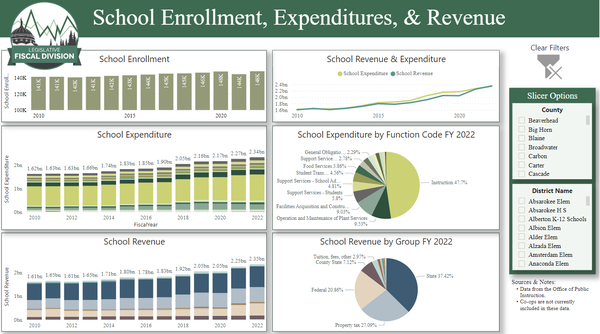
In addition, a tool was created to look back and look forward, comparing school revenues and expenditures by district. With the creation of this tool, comparisons and further analysis can be done relatively quickly as legislative questions arise. See below for the basic analysis of school revenues and expenditures.
Key Takeaways
Education leaders surmised that the following areas of education policy need the highest level of attention:
- Proficiency-based learning
- Transforming the teaching profession and increasing teacher retention
- Career and technical education
- Early childhood education
Several trends in school revenues and expenditures seen in the interactive tool below are the following:
- Enrollment in K-12 education was strongly influenced by the pandemic as parents sought alternative education sources for their children. It is unknown how this will impact long term enrollment growth.
- Expenditures for capital expenditures on school buildings and infrastructure have increased in recent years. Districts expanding enrollment or aging school infrastructure tend to be the highest growth areas.
- The forecast, not currently in the online tool, illustrates how future school age population forecast by location impacts the costs of K-12 education in different districts and the state. Differences between REMI and IHS Markit forecast for this age group can change the cost expectations.
*Click the link below this image to access the education data tool*
» School Enrollment, Revenue, & Expenditures Tool
»
Education Data Tool Technical Information
*Click the link below this image to access the education data tool*
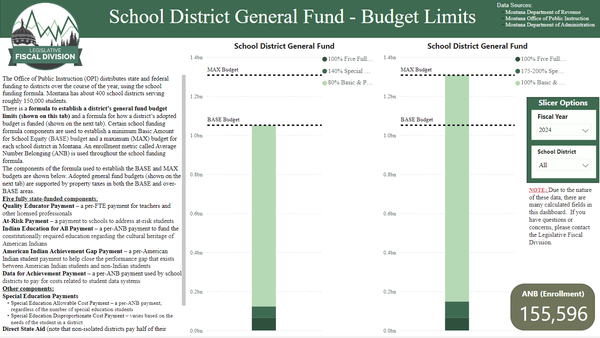
» School District General Fund Budget Limits Tool
»
School District General Fund Tutorial
- Education
- Reports
- Being a Teacher Needs to be the Best Job in the District (Jason Dougal & Ann Borthwick)
- Education & Workforce: Capacity Building (Stephen, Pruitt, Southern Regional Education Board)
- International Education Study Group 2020-2022 (National Conference of State Legislatures)
- K-12 Module Summary
- Learning from the Past, Looking to the Future (Organization for Economic Cooperation and Development (OECD))
- Montana's Constitutional Education Authorities Meeting Summary (NCEE, June 6, 2022)
- Montana School Board Association
- NCEE’s Blueprint for a High-Performing Education System (NCEE)
- Office of Public Instruction
- Perspectives on Current Initiatives
- Office of Public Instruction
- Montana School Board Association
- Redesigning Montana’s Education System for a Changing Global Economy (National Center for Education & the Economy (NCEE))
- Student Performance (the Nation's Report Card)
- Legislative Action
- A bill draft (PD 14) revising the Quality Educator Loan Assistance Program. This draft eliminates the requirements for qualifying educators to be teaching in a critical quality educator shortage area.
- A bill draft (PD 45) revising transformational learning and proficiency-based education. This draft provides clear definitions and increases accountability and selectivity for the program.
- Reports
ABOUT
Local governments, along with state government and schools, are one of three large government financial areas that affect all Montanans. As such they are an important piece when examining total governmental services and tax burden. One of the major areas of overlap is in the property tax system, the work here expands the ability to examine that system as a whole.
These data shown below are the submitted revenue and expenditure data from local municipalities to the Department of Administration (DOA). In response to this project DOA put in additional effort to get this data set as complete as possible, and this now gives a better representation of municipality revenues and expenditures than had been achievable prior to this work. While the forecast on municipalities is not yet complete, these data provide LFD the starting point to create forecasts and do property tax linkage work.
The Legislative Fiscal Division wishes to thank the executive branch's data effort for their collaborative role in the continued development of diverse data collections. When these data are available, both the legislative and executive branches will be enabled to provide improved analysis for decision makers.
Key Takeaway
- An almost complete local government financial data set.
- Summary statistics are now available to see the mix of spending and revenue, and to compare municipalities.
*Click the link below this image to access the local government data tool*
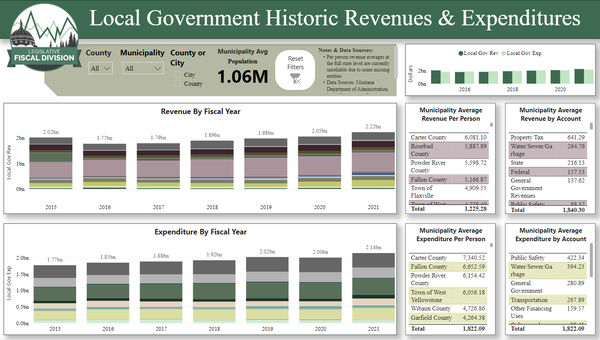
» Local Government Historic Revenues & Expenditures Tool
»
Local Government Data Tool Tutorial
- Local Government
- Reports
- HJ 30: Study of County Water and/or Sewer Districts (Toni Henneman, Local Government Interim Committee)
- Local Government Module Summary
- Reports
ABOUT
Property taxes in Montana are collected by multiple taxing jurisdictions such as the state, schools, local governments, and a variety of special districts. In order to better understand locally paid taxes and where the growth in property taxes has come from in the past, legislative staff created a property tax model. This work can help to answer questions in greater detail and examine certain proposed scenarios.
Key Takeaways
- In order to understand the growth of property taxes paid, new property and growth in TIF revenue was separated out from existing property growth
- Growth in property taxes paid alternates between years of large growth and years of smaller growth due to the residential property two-year reappraisal cycle. In the years between reappraisal, there are instances where growth in newly taxable property buys down the property taxes on existing property for certain localities
- Within each group of property taxes (existing, newly taxable, and TIFs), growth can be broken down between different taxing units (state, counties, cities, schools, & special districts). Growth in existing property is largely a function of decisions made by the entities collecting the taxes, while the growth in newly taxable property and TIFs is distributed proportionally between taxing units
- Taxes paid for residential property are increasing faster that taxes paid on all other types of property
*Click the link below this image to access the property tax data tool*

» General Property Tax Growth Tool
»
General Property Tax Growth Tutorial
- Property Taxes & Changing Land Value
- Reports
- 50-State Property Tax Comparison Study (Lincoln Institute of Land Policy)
- History of Property Tax Reports
- HJ 36: Property Tax Relief Options
- HJ 36: Study on Residential Property Taxes (Megan Moore, Revenue Interim Committee)
- Local Government & Property Taxes in Montana
- MARA TIF Follow-Up
- MARA TIF Overview
- Monthly Property Tax Payment Options (Megan Moore, Revenue Interim Committee)
- Property Tax Abatements
- Property Tax History
- Property Tax Limits
- Property Tax Statutory Authority
- Property Tax Revenues in Montana
- Residential Property Tax Brochure
- School Property Tax
- Presentations
- Comparison of State Property Tax Systems (Lincoln Institute of Land Policy)
- Property Tax Relief for Homeowners (Lincoln Institute of Land Policy)
- Property Tax Model: Newly Taxable Impacts
- Reappraisal Impact on Property Taxes Paid
- Web Links
- Reports
- Conservation Easement
-
Conservation Easement Report
- Conservation Easement (Video)
- Conservation Easement BI Tool
-
Conservation Easement Report

MARA Meeting Materials
Other Related Information
- Technology & the Future of Work (Pew Research Center)
- Evolved Energy Research (Jeremy Hargreaves)
- Annual Decarbonization Perspective (Ben Haley, Evolved Energy Research)
- I-West Introduction (Lee Spangler, Montana State University, Energy Research Institute)
- Montana Movers Study 2021 Report
ABOUT
The 2040 MARA project began in 2019 with a gathering of legislative questions about the Montana economy, demographics, and financial implications. Those questions were discussed in January 2020 during a gathering of the legislature. Work paused during COVID-19, but resumed June 2021 with a specific focus on gathering and compiling data to see the interconnectedness of government between the state, local governments, and schools. Legislative staff built interactive modules of the data, but time did not allow for analysis and refinement of the model. Next steps for staff will be at the discretion of the legislature and current plans are provided below.
Next Steps for the 2040 MARA Project
- Continue work on the expansion, consistency, and resiliency of all the data
- Broaden data analysis to more interim and standing committees through expansion into the following data areas:
- Public Safety Data Analysis
- Public Health and Human Services Data Analysis
- Expand Property Tax Analysis with new data acquisitions and legislative questions
- Further analyze and refine the forecast for Local Government Data
- Revenues
- Federal revenue to include analysis of specific federal funds and the implication to Montana if federal funding was reduced
- Further analysis of state and local revenue
- Further tax and revenue analysis as requested by the legislature
- Fully Connected and Forecasted
- School forecasts
- State expenditure forecast compared to revenue forecast
- Connection of state, local, schools within the property tax system
- Communication and outreach
- Expanded analysis for Interim Policy and Budget Committees
- Gathering issues and questions of importance from interim and standing committees
- Analysis and follow up on recommendations by various legislative committees
- Additional staff for the Fiscal Division to be able to fulfill this mission

![]()